6 Tips on Writing Infographics
In the last decade, infographics have proven themselves to be some of the most effective marketing tools out there. They have helped marketers attract backlinks, build a social media presence, increase website traffic, and drive more engagement.

However, marketers are not the only group of people that benefit from infographics. Governments, educational institutions, scientists, and researchers have all used infographics to communicate with the general public.
Look at this one for example:

This infographic was created by Cell Biolabs, a company that produces technology for life science research development. In the infographic, Cell Biolabs tries to educate the general public about the importance of microRNA.
Through simple words and attractive design, the infographic manages to take the general audience into a biological journey. It explains the basic of biology first, before slowly and gradually uncovering what microRNA is and what it does.
What’s an Infographic?
So, what is an infographic anyway? If you’re new to the world of visual design, this term might sound unfamiliar to you. In short, an infographic (a short term for information graphic) is a visual representation of data or information.
Infographics are used to convey complicated data and messages as beautiful and easily digestible content that everyone can understand. It combines engaging visuals with a short and well-written copy to communicate certain information quickly and clearly.
It is a great tool to promote your brand or organization because infographics are three times more likely to be shared than any other form of content. The more useful and valuable your content is, the more likely people will share it. This is an example of one of the most shared infographics ever made:

Source: entrepreneur.com
This infographic managed to gain 25 thousand shares because it gives new facts and knowledge to the audience.
Why Use Infographics?
Now that you know what an infographic is, it’s important to know why you need to use it. It can be useful to you especially if you’re a marketer, content writer, or just happen to be working in the digital marketing industry. Here are five reasons to use infographics in your marketing campaign:
1. Humans Love Visuals
Humans are naturally visual creatures, as 70% of our sensory reports come from the eyes. We remember and understand visuals better than text, that’s a fact. Thanks to this trait, infographics generally do better than text-only content, as suggested by a study from Venngage. The study found that content with a relevant image can attract 94% more views and 180% more engagement than text-only content.
2. Easy to Share
As mentioned before, people are three times more likely to share an infographic than any other content. That’s because infographics are generally easy to share on social media and other sites, thanks to its small-sized nature. The more people that share your infographic, the more awareness and recognition that your brand will get.
3. Higher Engagement Rate
Infographics are some of the most effective tools to build your social media presence and audience engagement. Multiple studies found that social media posts with images receive a double engagement rate on Facebook, 150% more retweets on Twitter, and a 98% higher comment rate on LinkedIn.
4. More Traffic to Your Website
It’s proven that infographics can boost the traffic to your site by 12% if marketed the right way. How? You need to build your backlinks by reaching out to other websites to post your infographic. Of course, you have to give something in return. The more backlinks you get, the higher your Google ranking will be, resulting in more quality traffic.
5. Longlasting Effects
If you create an infographic that’s valuable, evergreen and not bound to a certain period, people will keep sharing it even years after it was initially published.
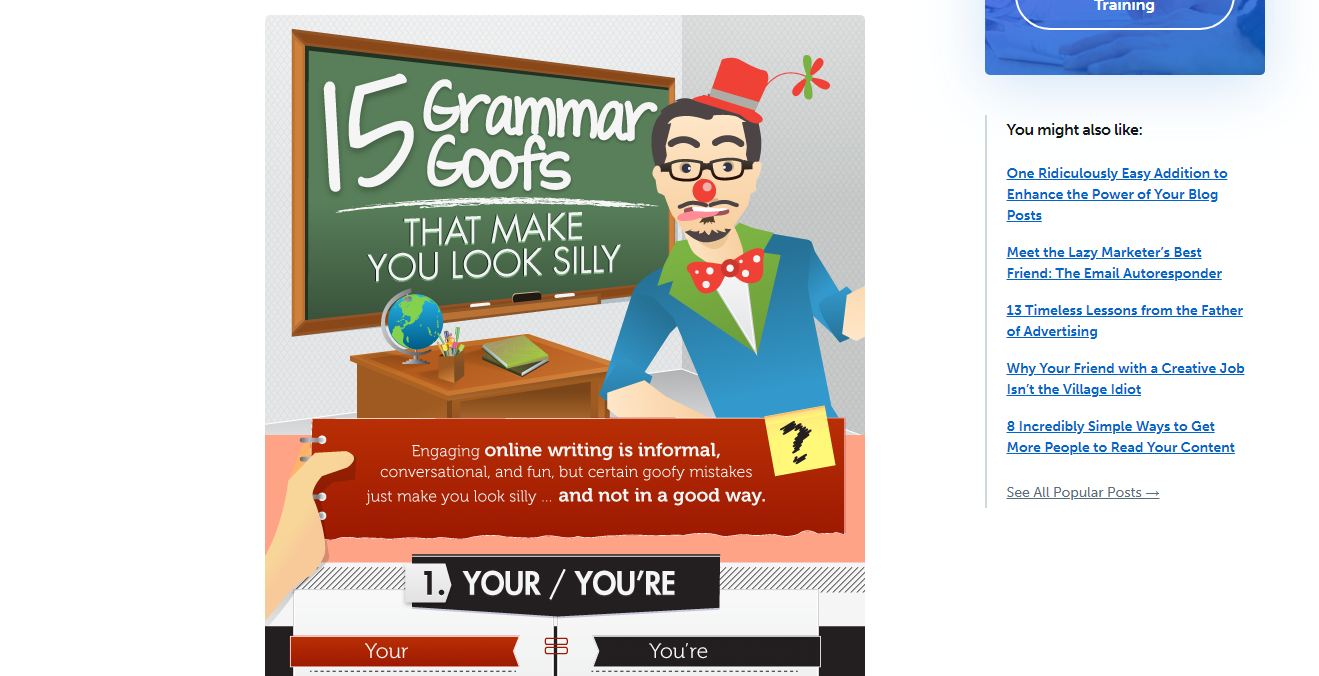
In 2012, Copyblogger created an infographic about 15 Grammar Goofs that people make daily. Because it’s so relatable and timeless, this infographic has since amassed 503 comments, 6,500+ tweets, 60,000+ likes on Facebook, 2,000+ LinkedIn share, and 194,600+ Pinterest pins. It’s still going strong today, driving backlinks and traffic to the Copyblogger site.

Tips on Writing Infographic Copy
From 2012 to this day, we at Milkwhale have had our infographics appear in websites like Entrepreneur, Daily Mail UK, The Huffington Post, and many more. Does that make us experts in this field? If you go by Malcolm Gladwell’s 10,000-Hour Rule, no we’re not.
Although we’re no experts, we’re still experienced enough with ups and downs in this industry. We can give you a few tips and tricks on how to write an infographic copy.
So, enough with this rambling, let’s jump right into these 5 infographic writing tips.
1. Create a Compelling Headline.
Like other kinds of content such as articles or videos, the headline is the first thing that the viewers will see when they come across an infographic. Make sure to create an engaging headline, because you only have 10 seconds to capture the audience’s attention before they turn away.
After the audience is hooked in by the headline, welcome them with a short introduction of what the infographic is about to suck them even deeper into the infographic. Example of a viral headline in 2011:

2. Keep it Short and Sharp.
The first important rule I learned in this industry is to always remember that you’re writing an infographic, not an academic essay. Keep your words short and sharp, and avoid overexplaining things. Ideally, an infographic has about 150 to 400 words.
Also, by keeping your words short and sweet, you’ll leave plenty of room for white space. White space, also called negative space, is a space around the infographic that needs to be blank. Otherwise, the infographic will become too congested and hard to read.
3. Avoid Using Flowery Words.
Remember the point above, we’re not writing a thesis here. Try to refrain from complicated words or terms that the general public isn’t familiar with. The whole point of creating infographics is to make complicated data easier to understand. Always keep in mind that you’re writing for people and not robots when making infographic copy.
4. Blend Text and Visuals Together.
A study by Visme found that some people understand information better with visuals, while others cope better with text. Infographics are all about blending visuals and text. The best copy in the world could never elevate a poorly designed infographic and vice versa.
Thus, as an infographic writer, you’re not only demanded to have incredible writing skills, but also imagination. You have to imagine what will the visuals be like while writing an infographic so that the visual design and the copy can complement each other.
5. Write Based on Facts, Not Opinions.
Infographics were made so that the general public will understand research results, statistics, surveys, graphs, and other complicated data better. This means that the content should be based on facts and not your own opinion.
6. Keep it Flowing
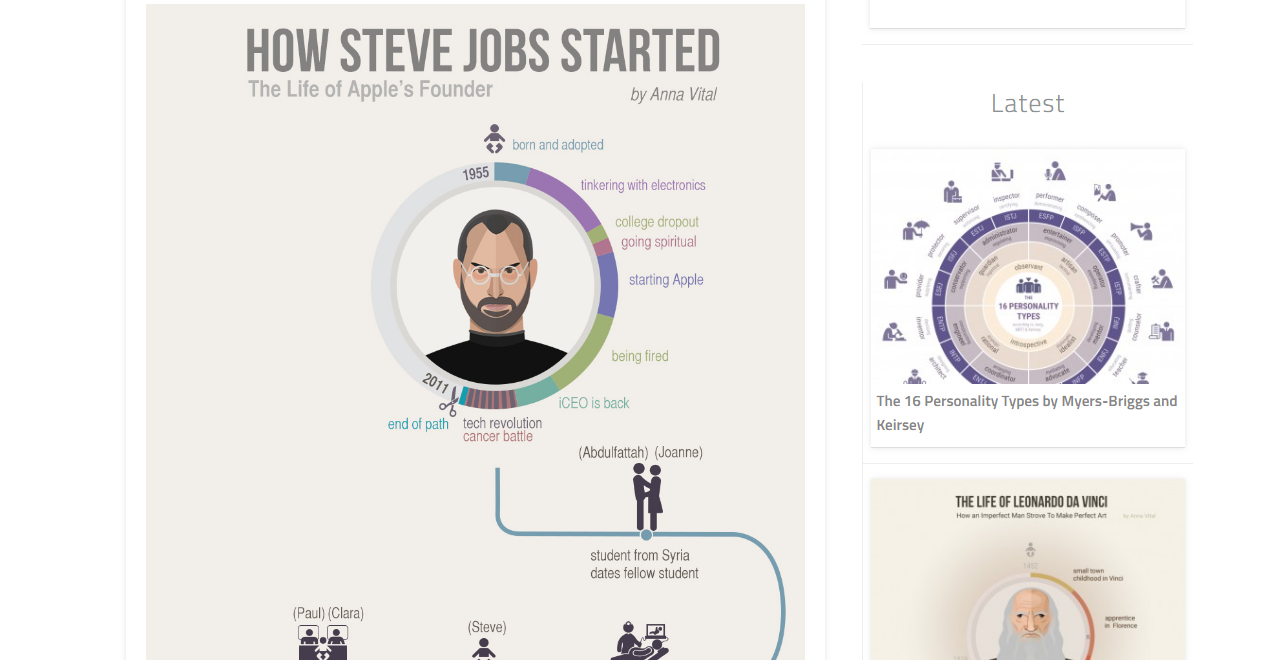
An infographic is like a good story; it needs to flow cognitively as well as visually. You need to discuss with the design team to find the perfect harmony and balance in your infographic. The written copy and visual design have to integrate seamlessly. That’s to create a flow in the storytelling that hooks the audience to the end of the infographic, like this one from Anna Vital:

Conclusion
If there is one thing no one can deny, it’s that infographics remain a very relevant digital marketing tool to this day. As such, you should be taking advantage of them as well. So, if you’re looking to create an infographic or are just interested in learning more about general writing tips, check out this article. The article covers the basics of writing and also a few tips on how to improve your writing.
Read more here.
21+ Awesome Tips for Successful Ebook Marketing [Infographic]
Checklist for Promoting Ebooks on Social Media in 2019
10 Reasons Why Writing Daily Makes You a Better Writer


Oliva
August 27, 2024This article provides clear and practical tips for writing effective infographics. The focus on simplicity and integrating visuals with text is particularly helpful!
Kotobee
August 28, 2024Thanks, Oliva! We’re glad you found the tips shared in this article helpful 🙂